Largest Contentful Paint
As part of Core Web Vitals, the Largest Contentful Paint (LCP) score measures the perceived loading speed of a website. This user-centric metric is most noticeable by the naked eye compared to other web performance metrics and measures the elapsed time to display the largest content of a web page on the screen visible to a viewer before scrolling.
This article explains the technical aspects of LCP and helps answer the following questions.
What is the Largest Contentful Paint?
The Largest Contentful Paint refers to the biggest visual part of the page. It reports the render time for the largest visible element (often images) in the viewport before a user scrolls down or taps a button.

Primarily, LCP only considers the objects that are located above the page fold, which is the content visible to the user without scrolling. These objects normally include elements such as hero images, block-level texts, or video poster images. LCP does not consider anything that falls outside of the viewport (the visible area of a web page that can change based on the device used for browsing).
Largest Contentful Paint vs. First Contentful Paint
In contrast to the load time for the largest element, First Contentful Paint (FCP) refers to the time taken by the first visual element to appear in the viewport.
While traditionally, the site’s overall loading speed determines its performance, LCP and FCP have become the recognized measurements used in the industry to gauge a website’s perceived load speed.
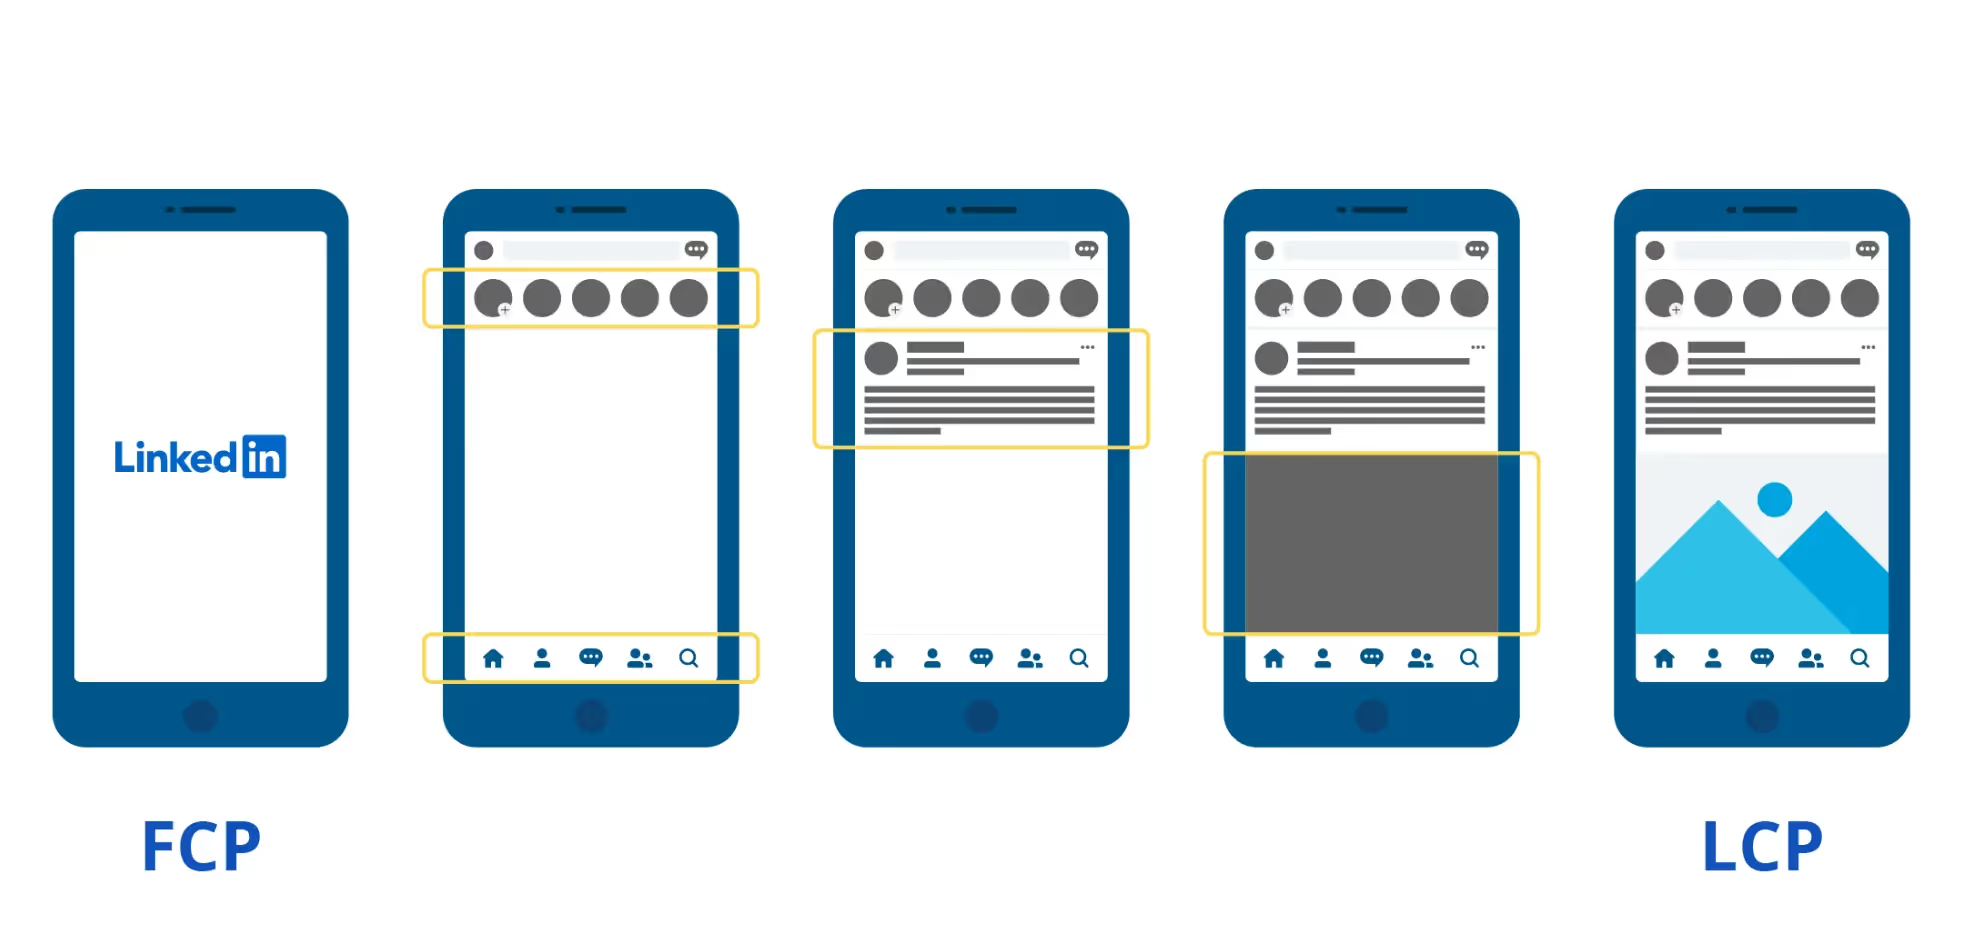
Here is how the LinkedIn website loads, showing FCP and LCP, and how the largest element changes as the content loads
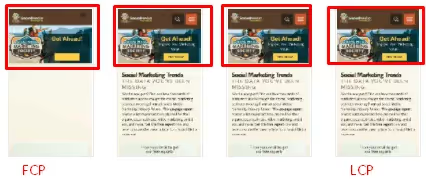
Here’s another example of a famous Social Media Examiner website in which the largest element remains the same as the content loads
While FCP is an important metric, it is not a critical metric as LCP because it simply measures the moment the web page shows the first visible element that may be well in advance of other larger elements. On the other hand, LCP is more closely correlated to the user experience, and a fast LCP usually minimizes user irritation.
{{banner-35="/design/banners"}}
Why does Largest Contentful Paint matter for SEO?
While thinking about the relationship between Search Engine Optimization (SEO) and LCP, remember that the Google search engine algorithm considers LCP a significant ranking signal for measuring page experience. If a website has a sophisticated design, attractive products, and good content but takes too long to load, it will create a bad user experience. The faster the site loads, the better will be its ranking on the Google search results page.
Case Study: The Largest Contentful Paint Business Impact
Vodafone is one of the largest wireless service providers globally, with over 90,000 employees operating in 22 countries. A case study documented by Google claims that the company was able to increase its sales by 5% on the back of improving its LCP by 31% by converting more website visitors to purchases. That increase translates into tens of millions of dollars given Vodafone’s size.
They conducted an A/B test with two landing pages (the two screenshots below), each receiving 34k visitors from multiple channels, including display ads, social media, and organic search.
The screenshot on the left leveraged the best practices for improving LCP, also explained later in this article. In this case, the improvements involved shifting some logic from the client-side (the phone) to the server-side and improving how the images were formatted and loaded.
Based on these improvements, the largest contentful paint happened in 5.7 seconds instead of 8.3 seconds, which improved the sales conversion results from the page on the left by 11 to 15%.

{{banner-36="/design/banners"}}
How to Measure the Largest Contentful Paint?
The types of individual elements commonly considered for LCP include;
It’s worth noting that as of the time of this article’s writing, svg and video elements are not used for calculating the LCP score but may be added in the future.
How is element size determined?
Typically, the element’s size visible to the naked eye within the viewport is reported for LCP.
Size = Width x Height
The margin, padding, and border are not part of the size calculation.
Remember to distinguish between the intrinsic size (original size of the uploaded element) instead of the visible size of the element. Google considers whichever pixel size is smaller between the visible and intrinsic sizes to calculate the element size.
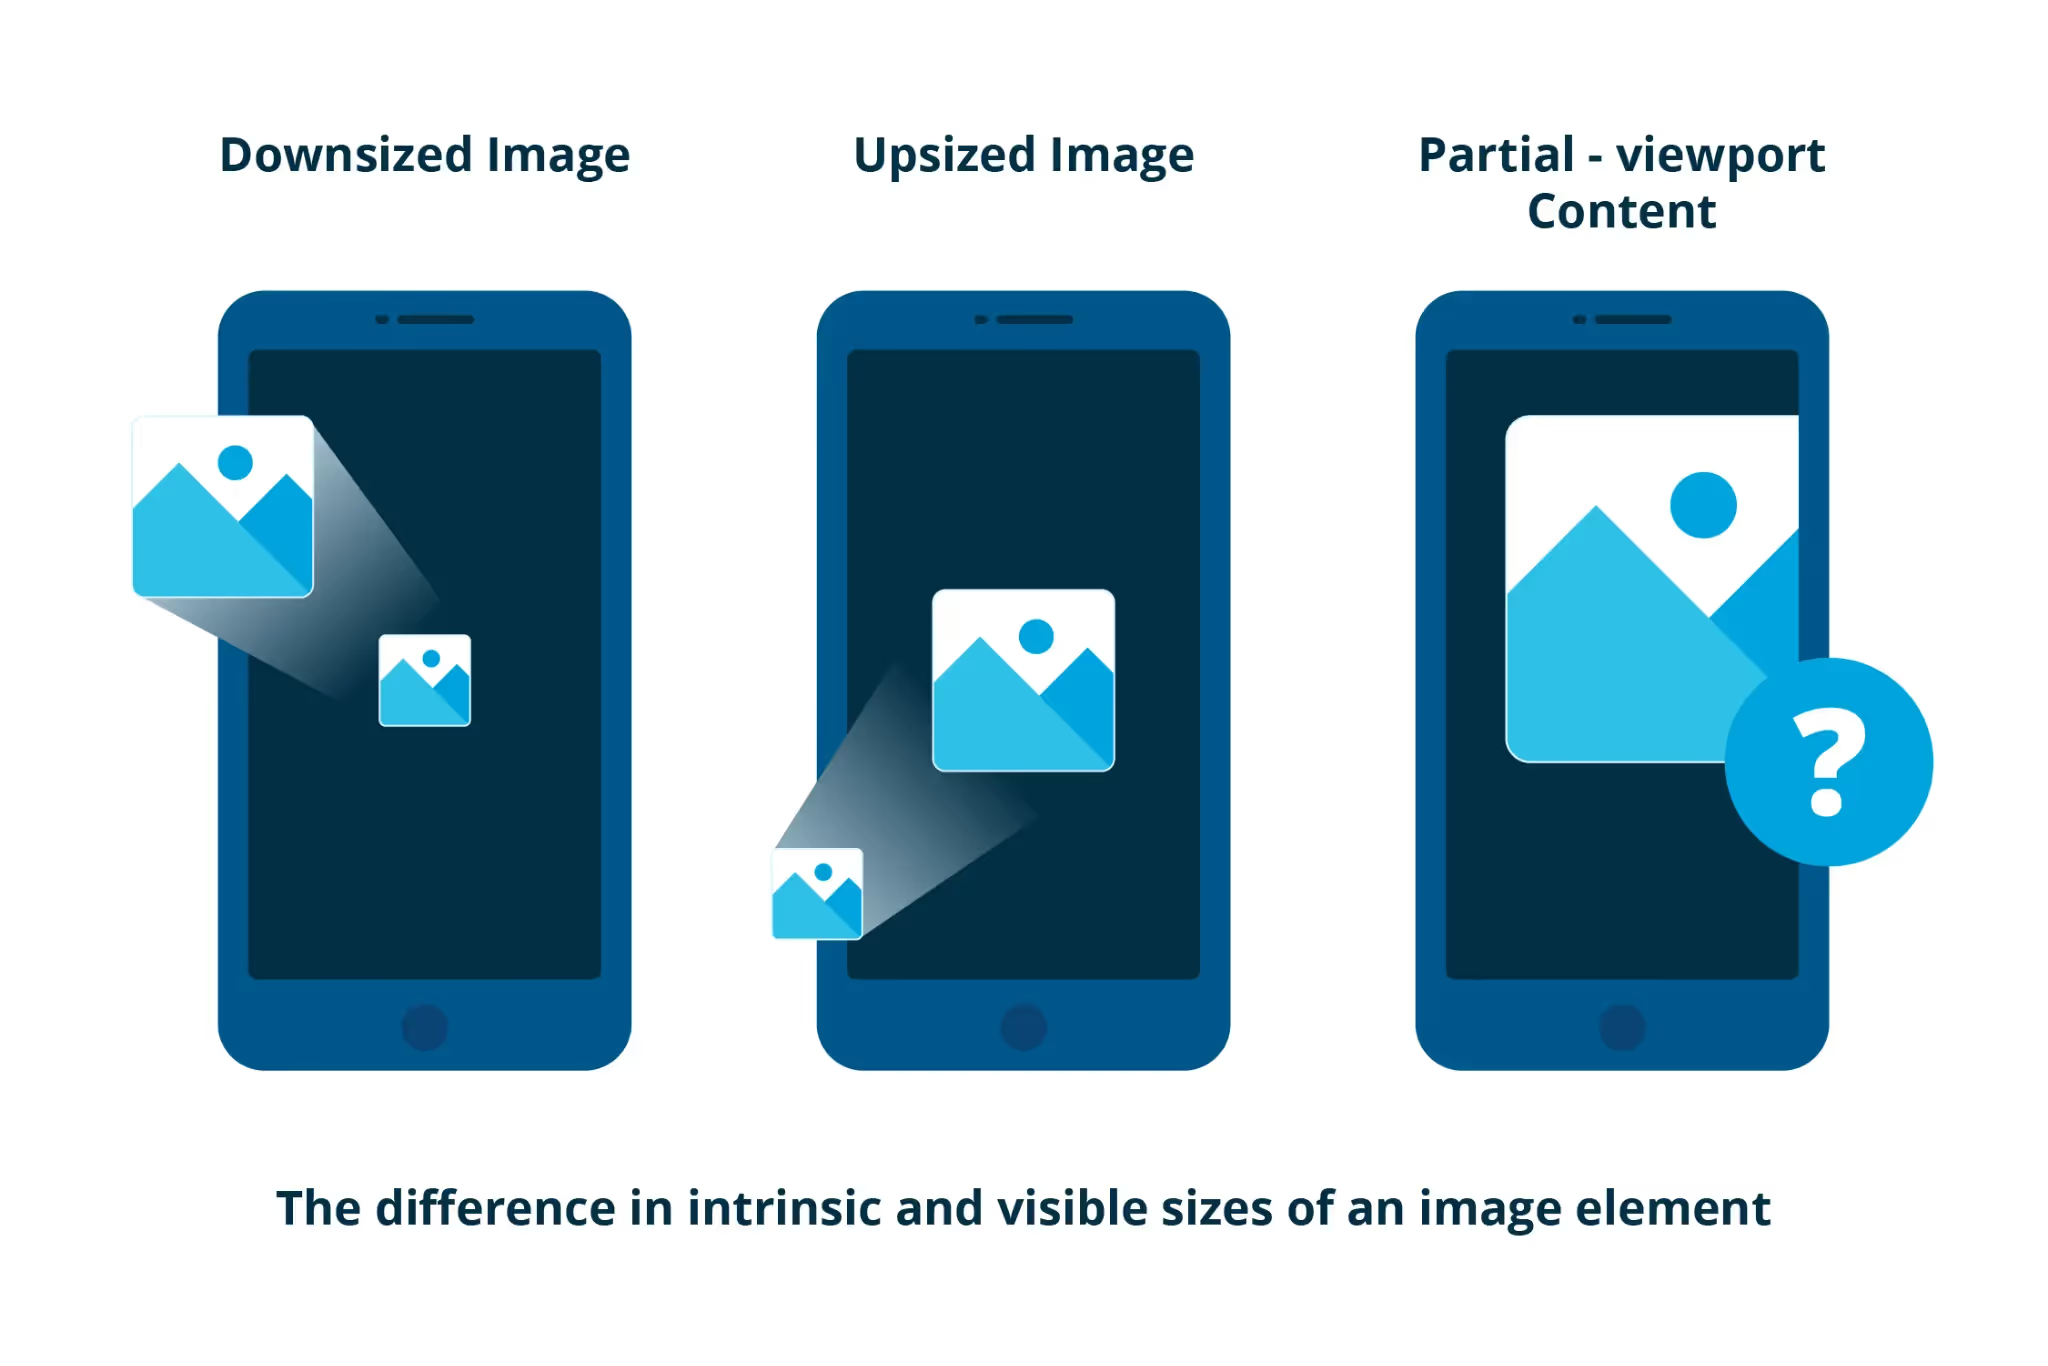
The Tools to Measure Largest Contentful Paint
You can measure LCP using either lab tools (measured based on emulated transactions) or field tools (measured with actual user traffic).
- Lab tools (a synthetic monitoring tool such as WebPageTest): It refers to algorithm-based performance simulations.
- Field tools (real user monitoring): It is directly performed on the live site based on real-world traffic. The tools used for this measurement include the Google Search Console (the new core web vitals report) and the web vitals JavaScript library.
Follow the steps below to quickly find the largest element using WebPageTest:
- Go to www.webpagetest.org/webvitals
- Enter the web page URL you want to test (we used this URL in the example below).
- Click on Start Test and wait a couple of minutes to get the final results.
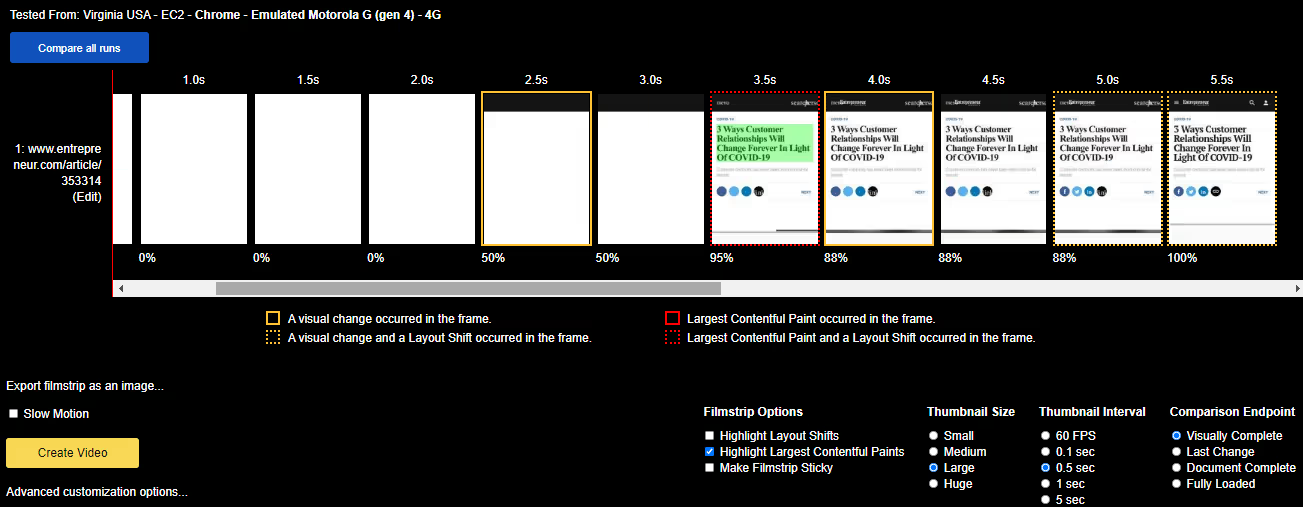
- Select View as Filmstrip to see the entire test frame-by-frame Or View Video to watch a recording of the user experience as the page loads. These two features are unique to WebPageTest and a core differentiating factor compared to other measurement methods.

The archived report generated by WebPageTest is accessible here.
In this example <H1> is the largest element causing LCP.
You can use the following options in Filmstrip View for better understanding.
- Highlight Largest Contentful Paints
- Thumbnail Size: Large
- Thumbnail Interval: 0.5 sec
Advanced Largest Contentful Paint Measurement: Web Vitals Library
Developers can instrument a web page’s code to log LCP values to the browser’s console (third line of the code). This approach measures the real user traffic using the Largest Contentful Paint API.
The code below helps developers collect the LCP measurement values from the console log for reporting or integration into third-party or home-grown tools.
LCP Score Interpretation
Google considers a website’s perceived load time of less than 2.5 seconds to be “good”. The table below provides a summary of the load time value ranges and the rating for each.
Example of a good Largest Contentful Paint score
The screenshot below shows Socialmediaexaminer.com with a good LCP score, which is highlighted by a red rectangle. Check the complete archived web performance report here, generated by the WebPageTest tool.

Example of a Largest Contentful Paint Score that can improve
The LCP score shown in the screenshot below is from a published article on Forbes.com. The score is 4.2 seconds and is considered a value that penalizes SEO ranking and requires improvement. Check the complete archived web performance report here, generated by the WebPageTest tool.

{{banner-37="/design/banners"}}
What contributes to a poor Largest Contentful Paint score and how to fix it?
We explain the various issues causing a poor LCP score in this section and provide instructions for fixing them.
1. Slow Server Response
The server on which your website is hosted can take too long to respond to the user requests, causing a poor user experience. You can measure your server response time using a metric known as the Time to First Byte (TTFB). According to the WebPage Test glossary, “TTFB is measured as the time from the start of the initial navigation until the first byte of the base page is received by the browser (after following redirects).”
A high TTFB indicates that your server is approaching its maximum capacity. Google recommends maintaining your web page’s TTFB to be less than 200ms.
In the following screenshot, you can see the red boxed area – First Byte Time – denoting ‘Grade D’ for an article published on bbc.com/news, which suggests that the server response time has an underlying performance issue.
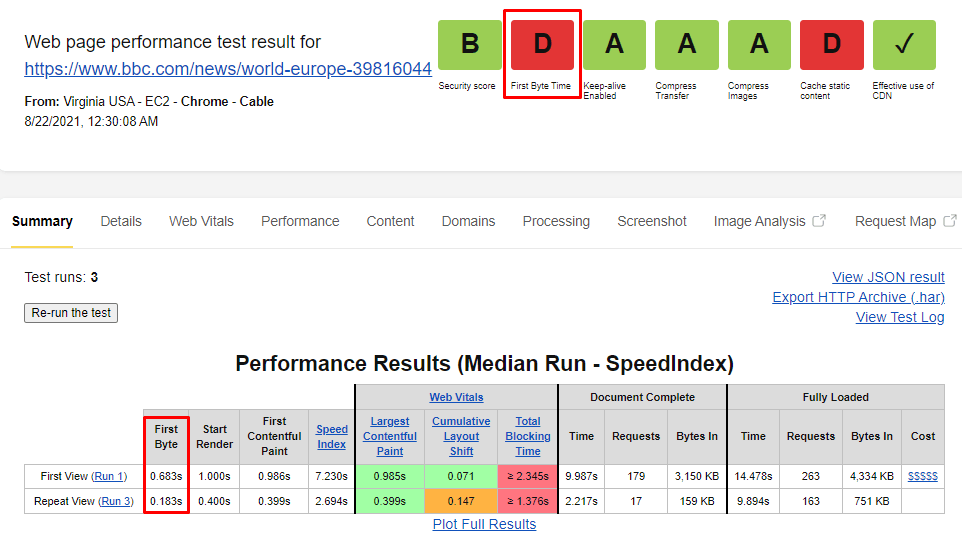
By clicking on the “First Byte” grade, you will see the details (also shown below), including the measured TTFB value and a recommended value that the web publishers should target in this case.

How to fix it?
- Improve Server Performance
The simplest of all solutions to improve server performance is upgrading your hosting plan. If the hosting server is overloaded, you need to optimize it by fixing the bottlenecks (e.g., heavy traffic, slow routing, resource CPU starvation, slow database quire, memory starvation, etc.) that slow down your systems.
You can optimize your server capabilities by:
- Increasing the number of servers if the current and expected CPU usage exceeds 80%
- Enabling compression via updating the server configuration to reduce the data transfer size
- Optimizing large files such as hero images for a quick and significant decrease in the size of your website.
- Activate Content Delivery Network
Another option to improve your server response time (and thereby TTFB) is to host the largest elements of your web page content (such as images) onto a Content Delivery Network (CDN) that replicate them on servers around the globe. With this approach, the largest elements of the page are downloaded from a CDN localized to the user’s geography, thereby reducing the load time. The primary function of a content delivery network (CDN) is quick content delivery to your target users through an extensive network of servers managed by a CDN provider. CDNs can also help with load balancing and image compression.
- Enable Caching Your Website
Cache your content (images, text, and more) to lower the page load time and the site’s TTFB, so it doesn’t have to reload every time. You can do it at the server level or go with a caching plugin.
In case of static HTML that doesn’t need to be changed on every request, you can use a service worker that will run in the browser background and serve the cached content first. Browser caching will deliver the largest contentful paint faster than the regular roundtrip to a local CDN.
- Establish Third-Party Connections Early
You can do this by using the preconnecting and prefetching feature on your website if it contains third-party scripts such as videos or Google fonts. With this approach, the browser fetches content while the user is browsing the content that has already been loaded.

Adding the attributes rel="dns-prefetch" or rel=“preconnect” tag to a <link> informs the browsers that your web page intends to be connected with another domain and that you would like to perform this process as soon as possible and before the user clicks.
You can also use Prefetch DNS for various other external assets Google Analytics, Google fonts, and even a CDN, as shown below.
You can eliminate roundtrips latency from the request path by even thousands of milliseconds – saving render-blocking time for users by increasing load speed.
Here are some specific examples.
Preconnect hint for dynamic URLS:
Preconnect hint with JavaScript:
2. Render-blocking CSS and JavaScript
A browser needs only the essential elements required to construct a page before rendering it for viewers to see. Any other element or code (such as a JavaScript or stylesheet) that can be loaded after the page is rendered is considered non-critical to displaying the web page. The loading and processing of non-critical elements unnecessarily slow down a page’s rendering time. This concept is referred to as render-blocking and is a common cause of website loading delays. Since the browser must first download and process it before knowing if it’s critical or not, it’s the job of web developers to make this process lean.
In the waterfall view of the same bbc.com/news example shared earlier in this article, you can see the render-blocking resources shown in the following screenshot.

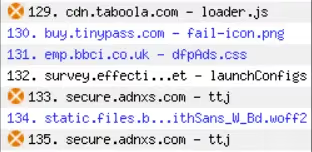
WebPageTest analyzes the browser rendering process and identifies the blocking files so that you can address them to improve your page loading time. You can click here (navigate to the “waterfall view”) the detailed archived report produced by WebPageTest showing CSS and JS elements causing page load delay.
How to fix it?
You can improve your LCP score by delaying the JS and CSS files loading. For instance, if your website contains a lot of large JS files, but you defer non-critical ones and initially call for loading a slider with minimum text, you can easily reduce the render-blocking CSS and JS.
Clean up your script and remove all the unnecessary third-party scripts. For example, the iconic social media badges presented on blogs to help readers share are viable candidates for a delayed loading. Here is a checklist of best practices for improving render-blocking:
- Minify your CSS
- Defer non-critical CSS
- Defer Inline critical CSS
- Minify and compress JS files
- Defer unused JS elements
- Eliminate unused polyfills
{{banner-16="/design/banners"}}
3. Slow-loading resources
Sometimes the largest contentful paint element is too heavy for the user’s device, browser, and internet connection speed. The same page may load rapidly on a desktop but slowly on an older phone in a remote location. Images usually count for most of the loading delays, affecting the LCP score.
For example, we run WebPage Test on this Forbes article, and as shown in the screenshot below, you can see uncompressed images causing slow loading. The screenshot below shows the Content Tab of the WebPageTest results page, highlighting the relevant information in a red rectangle.
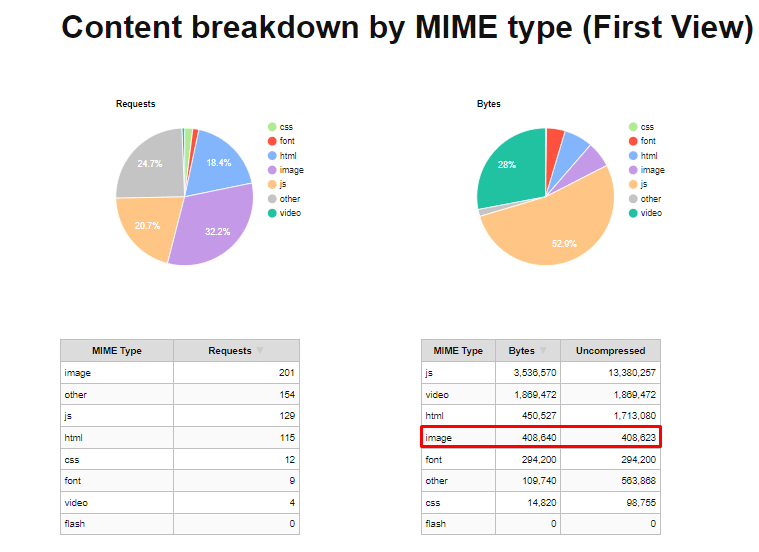
Go to the Performance Tab of the test result in the archived WebPageTest (linked below) for more details.


You can click here to see the details about these uncompressed elements playing a significant role in the poor LCP of the Forbes article under review.
How to fix it?
The simplest remedy in this situation is to compress and optimize large high-resolution images. Here is a list of best practices for addressing large images:
- Compress large images before uploading them to your site
- Use a plugin to compress the images once uploaded to your site
- Serve graphic content in WebP format instead of PNG or JPEG
- Preferably use high-quality and responsive images in correct sizes
4. Lazy Loading Issues
Lazy loading is often used to improve the user experience; however, in some cases these techniques could worsen LCP and therefore the user experience, instead of helping it.
Native Lazy Loading
Native lazy loading has become a browser standard since 2019 and enabled simply by using the attribute loading="lazy" on an image element. A well-researched article published on Google’s website on this topic states that 17% of websites, mostly those hosted in WordPress, use this feature. However, it can also hurt the LCP score. A web page’s LCP score worsens when all images on a web page including the hero image (when it’s selected as the largest contentful paint due to its size) inherit this lazy loading behavior.
How to fix it?
The native lazy loading functionality calculates the distance of an image from the visible portion of a viewport so that it can load faster the images above the fold. However, this native Browser feature also has an mode (known as “eager”) that loads images immediately regardless of its distance from the viewport. This mode can be invoked by using the attribute loading="eager". A simple solution to this problem is to tag the hero image with eager instead of lazy, or not tag it at all and allow it to load as a regular image.
Lazy Loading Using JavaScript
Lazy loading using customized JavaScript requires the browser to first load and execute the JavaScript and then load the image. When the large contectful paint is the hero image within the viewport on first page load then the LCP will naturally elongate.
How to fix it?
The solution is to simply not lazy-load the images that are within the viewport on first load. The team at NE Digital faced this exact issue and wrote an informative article about it. The image below shows how they used WebPageTest to compare the load time before and after the change. You see the bottom row loaded in 7 seconds while the top row waits and lazy-loads the hero image (the largest contentful paint in this case) as the last element.

5. Client-side Rendering Issues
Client-side rendering refers to managing the web pages not on the server side but entirely on the user’s browser. The use of massive JavaScript bundles or sub-optimal JavaScript logic can cause poor LCP. Moreover, the resources like SVG, videos, and images can badly affect the LCP when rendered above the first fold (before scrolling).
How to fix it?
- Compress and minify critical JS files to reduce the JS blocking time.
- Use server-side rendering instead of client-side rendering where possible.
- Consider using Accelerated Mobile Pages (AMP) to eliminate animations and heavy elements, improving the load times.
- Preload essential resources (refer to the earlier section in this article).
- Prioritize browser service workers for caching assets (background process responsible for caching).
Summing Up
The Largest Contentful Paint (LCP) is one of the fundamental elements of Core Web Vitals that measures the website page loading speed. More specifically, it measures how fast the page’s last element appears on the viewport. If a page takes more than 2.5sec to load, you need to consider improving your LCP score. You can use the options mentioned in this article for improvement. However, use WebPageTest first to identify the root cause for the sub-optimal LCP score.
{{banner-34="/design/banners"}}

